New Westminster Analytics
Tech Stack: Java, SQLite
View Demo Video (1 minute and 13 seconds)
Ever wondered what our neighborhood is like statistically? This Android App visualizes the demographics, buildings, and businesses in the City of New Westminster.
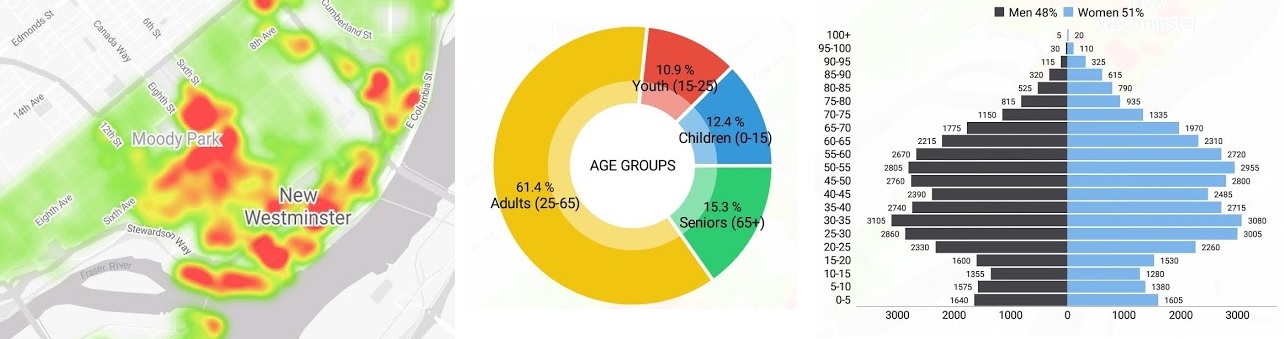
Demographics is visualized with: population density heatmaps, age group pie charts, and demographic charts.
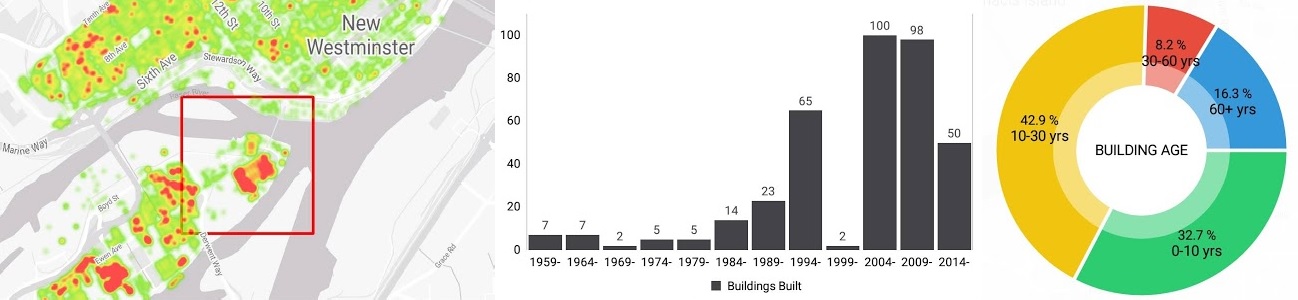
The building age is also visualized with a heatmap where red means newer and green means older. Building age charts can be shown for a specific area or the whole city.
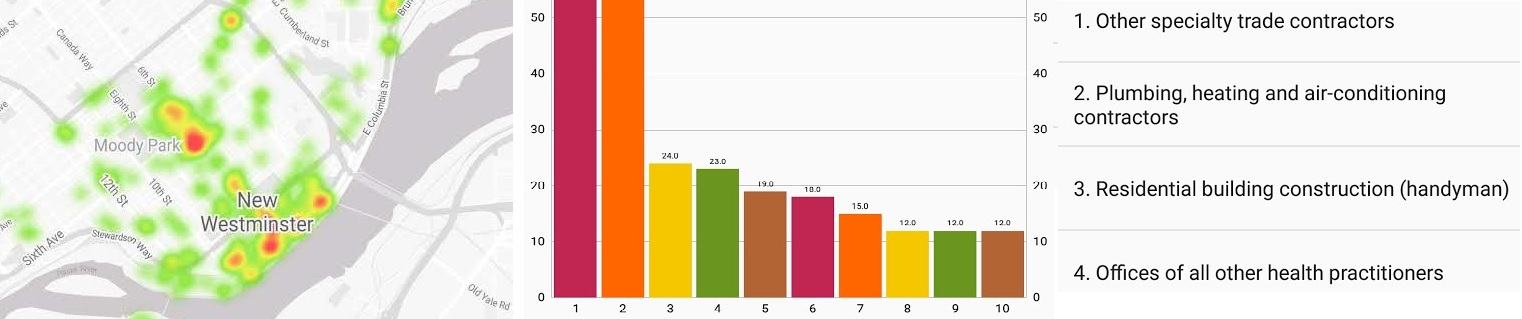
Business visualizations: density heatmap and most popular businesses chart.